Code Coverage for Vue Applications
Gleb Bahmutov | July 20th, 2020 | 6 min read
Let's take a Vue application scaffolded with Vue CLI like this bahmutov/vue-calculator app. In this blog post, I will show how to instrument the application's source code to collect the code coverage information. We then will use the code coverage reports to guide the end-to-end test writing.
The application
The example application can be found in bahmutov/vue-calculator repo that was forked from kylbutlr/vue-calculator which used Vue CLI default template during scaffolding. The code is transformed using the following babel.config.js file:
// babel.config.js
module.exports = {
  presets: [
    '@vue/app'
  ]
}
When we start the application with npm run serve, we execute the NPM script
{
  "scripts": {
    "serve": "vue-cli-service serve"
  }
}
The application runs at port 8080 by default.
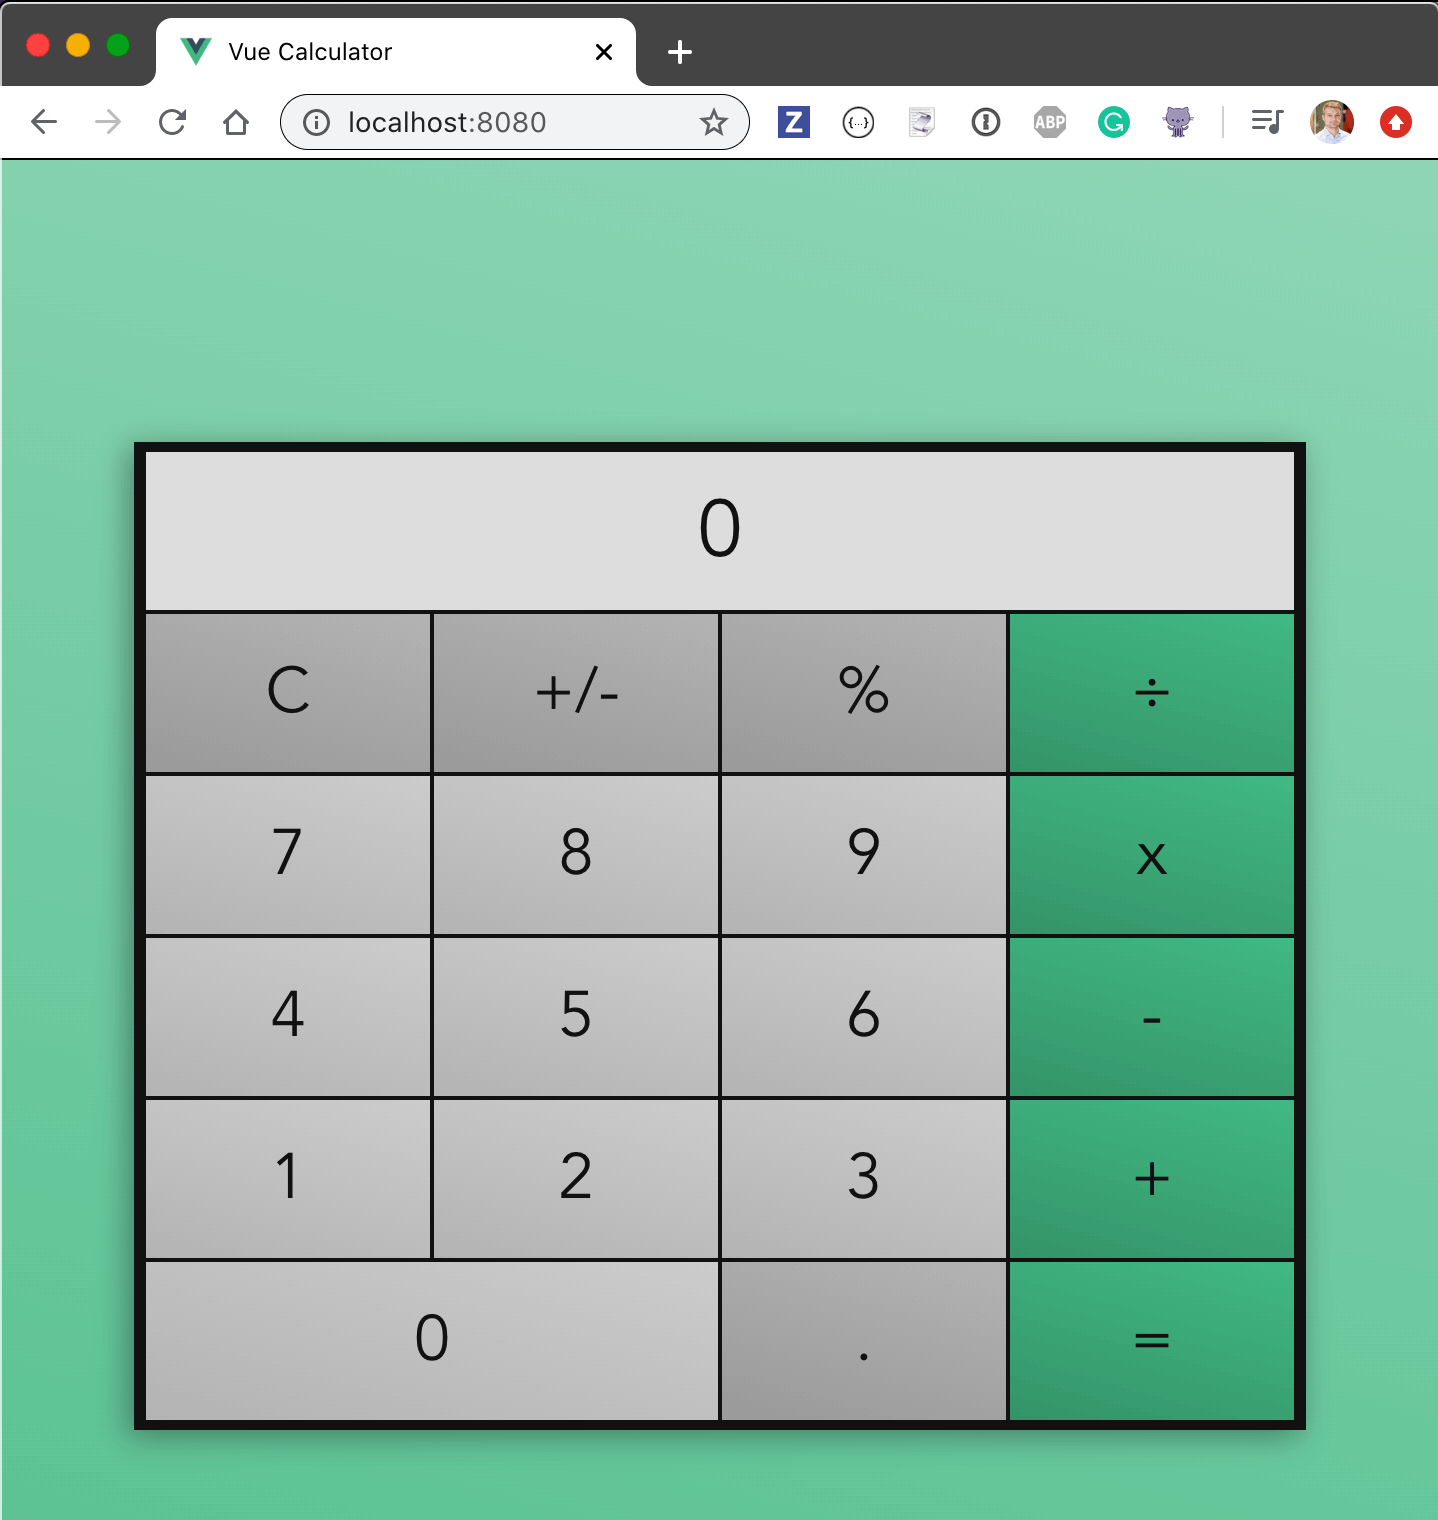
Tada! You can calculate anything you want.
Instrument source code
We can instrument the application code by adding the plugins list to the exported Babel config.The plugins should include the babel-plugin-istanbul.
// babel.config.js
module.exports = {
  presets: [
    '@vue/app'
  ],
  plugins: [
    'babel-plugin-istanbul'
  ]
}
The application runs, and now we should find the window.__coverage__ object with counters for every statement, every function, and every branch of every file.
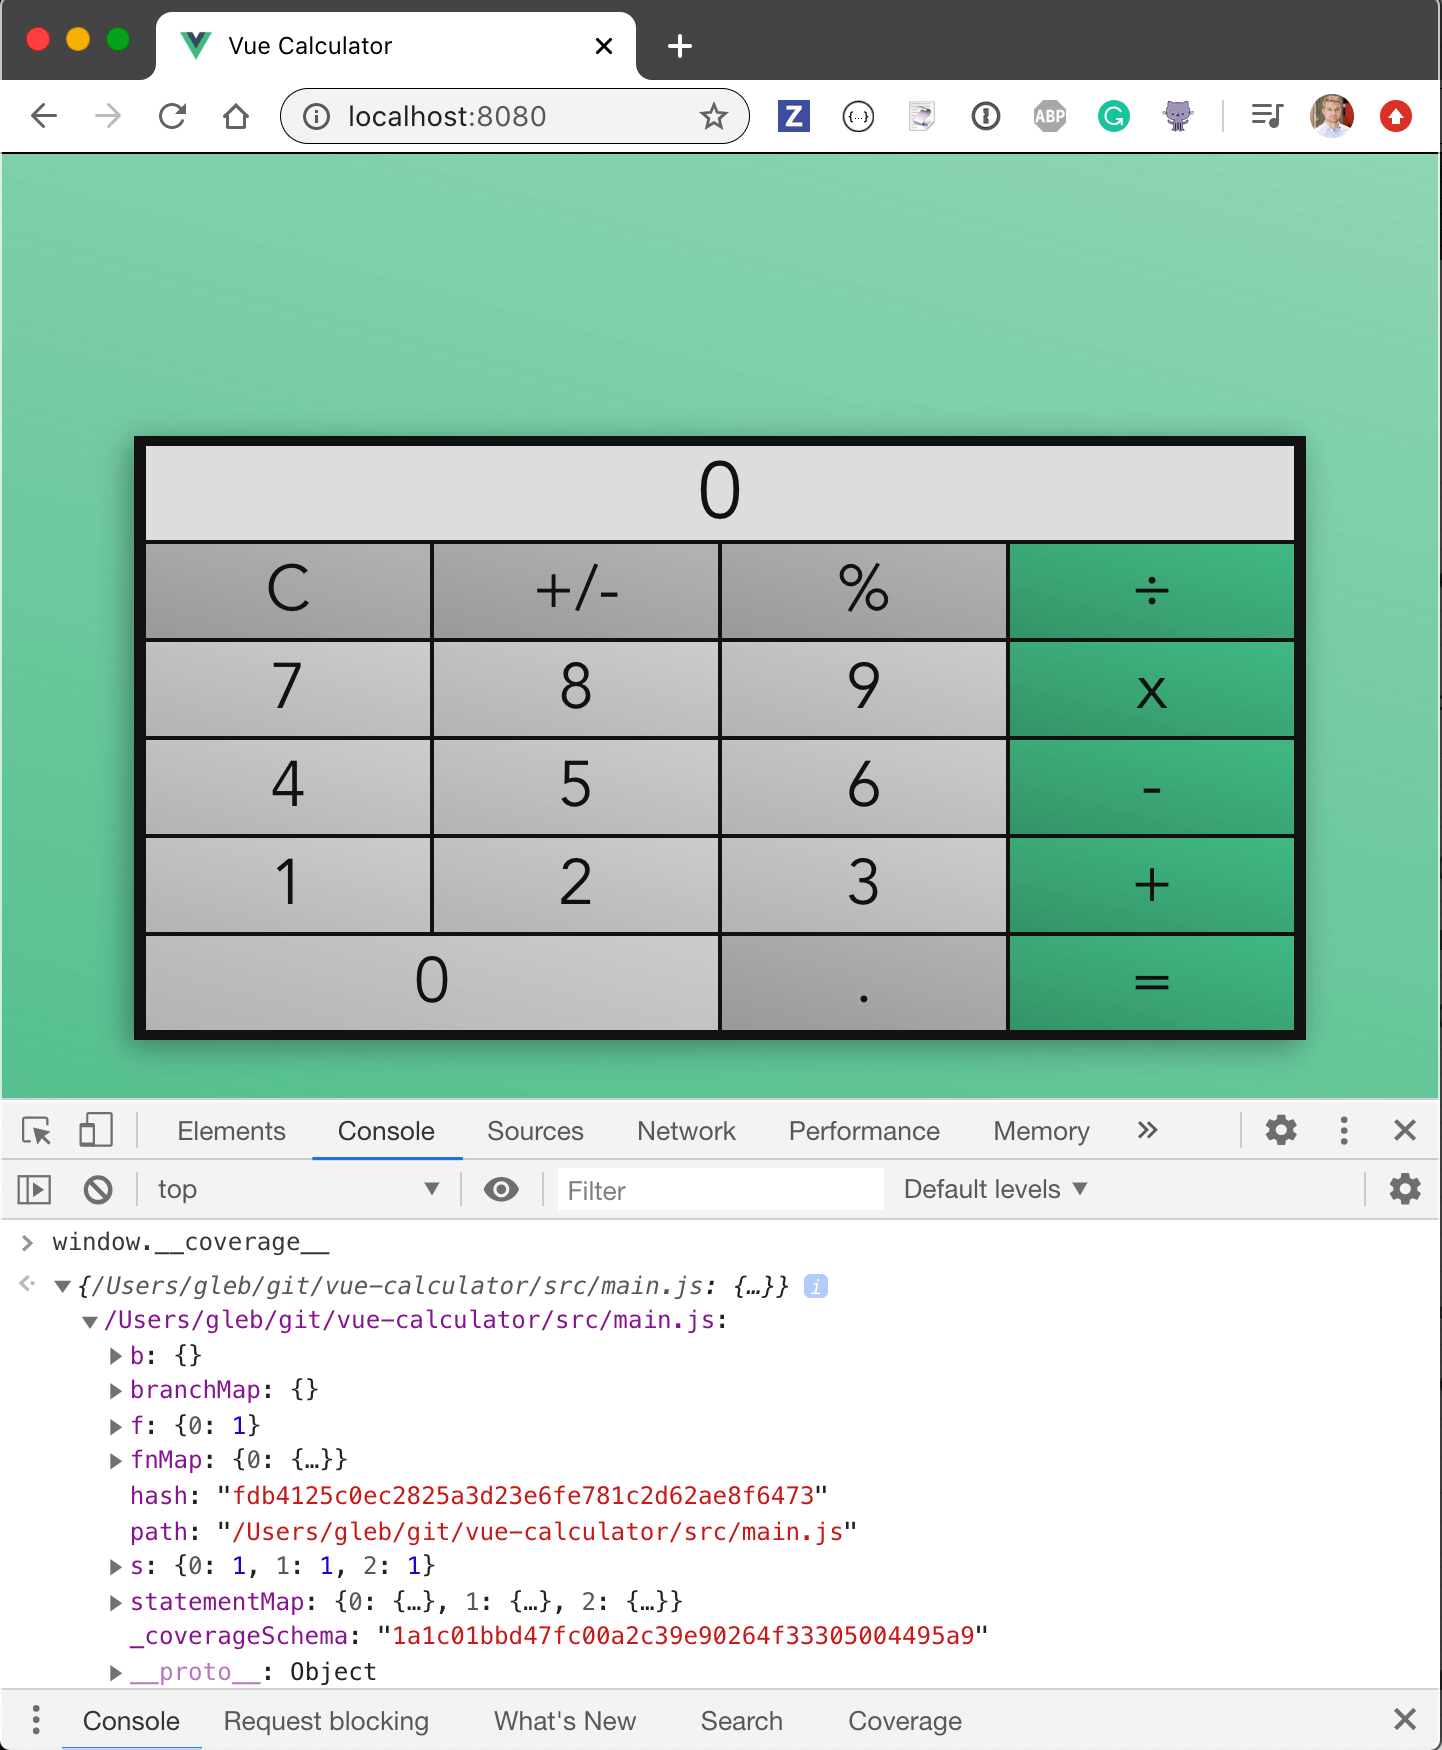
Except the coverage object as shown above, includes only a single entry src/main.js, and the coverage object is missing both src/App.vue and src/components/Calculator.vue files.
Let's tell babel-plugin-istanbul that we want to instrument both .js and .vue files.
// babel.config.js
module.exports = {
  presets: [
    '@vue/app'
  ],
  plugins: [
    ['babel-plugin-istanbul', {
      extension: ['.js', '.vue']
    }]
  ]
}
Tip: we can place istanbul settings in a separate file .nycrc, or add them to package.json. For now, let's just keep these settings together with the plugin itself.
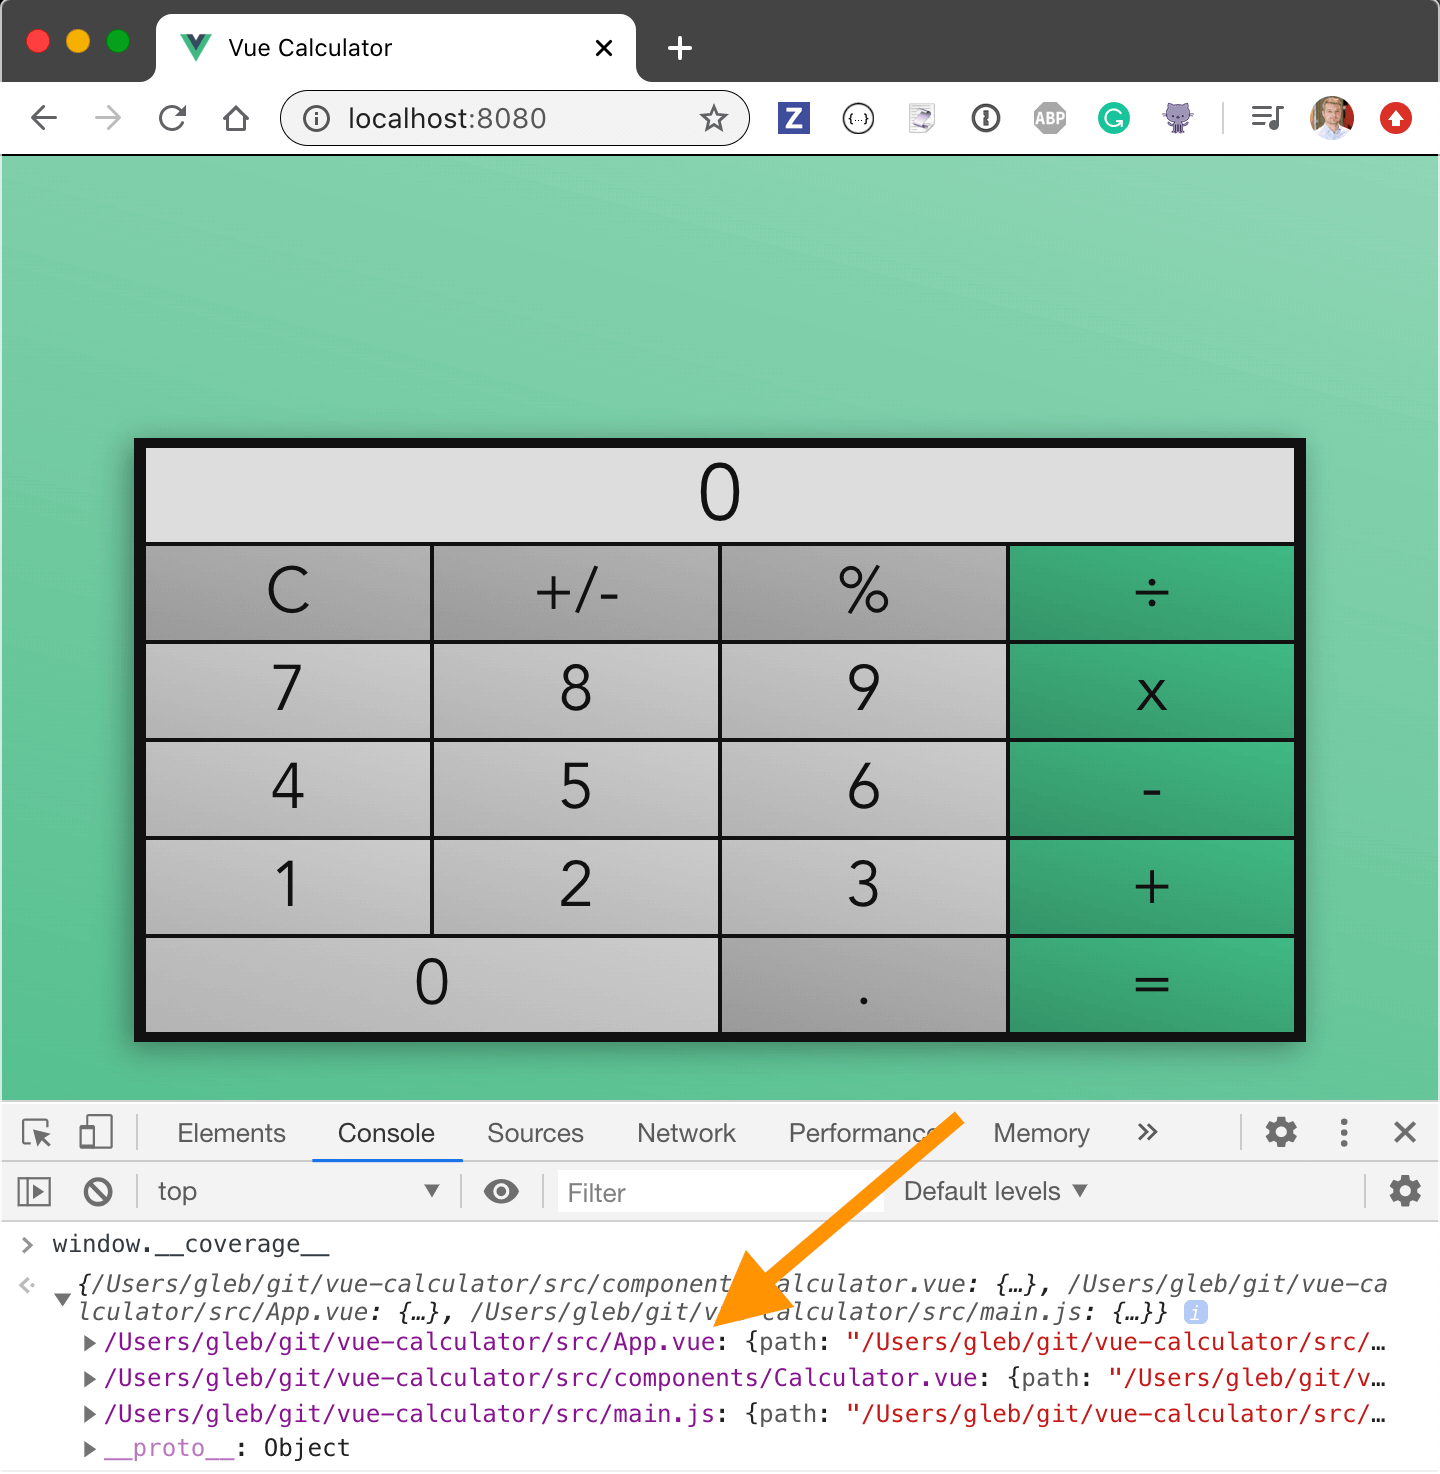
When we restart the application, we get a new window.__coverage__ object with entries for .js and for .vue files.
Conditional instrumentation
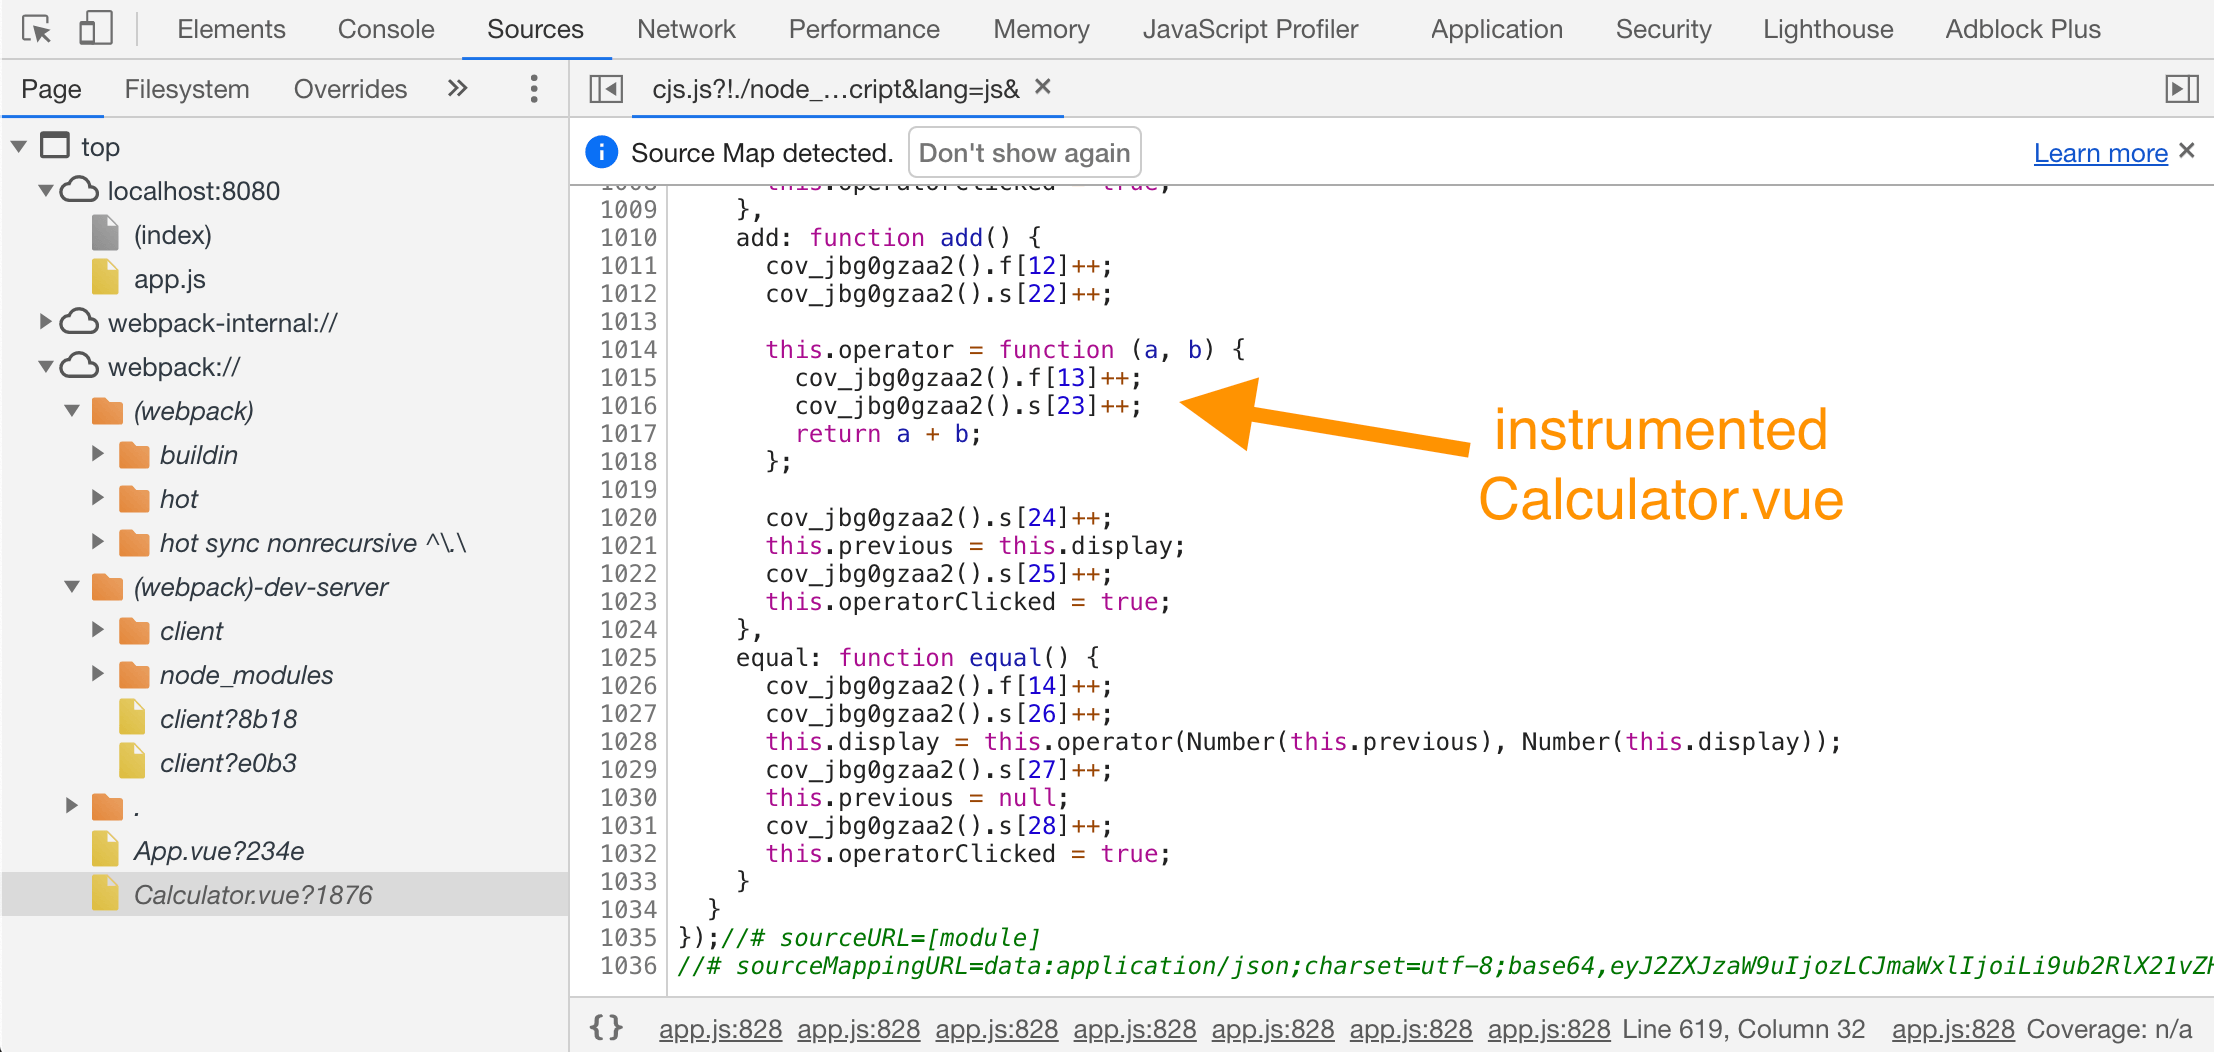
If you look at the application's bundle, you will see what the instrumentation does. It inserts counters around every statement, keeping track how many times a statement was executed. There are separate counters for every function and every branch path.
We do not want to instrument the production code. Let's only instrument the code when NODE_ENV=test since we will use the collected code coverage to help us write better tests.
// babel.config.js
const plugins = []
if (process.env.NODE_ENV === 'test') {
  plugins.push([
    "babel-plugin-istanbul", {
      // specify some options for NYC instrumentation here
      // like tell it to instrument both JavaScript and Vue files
      extension: ['.js', '.vue'],
    }
  ])
}
module.exports = {
  presets: [
    '@vue/app'
  ],
  plugins
}
We can start the application with instrumentation by setting the environment variable.
$ NODE_ENV=test npm run serve
Tip: for cross-platform portability use the cross-env utility to set an environment variable.
End-to-end Tests
Now that we have instrumented our source code, let us use it to guide us in writing tests. I will install Cypress Test Runner using the official Vue CLI plugin @vue/cli-plugin-e2e-cypress. Then I will install the Cypress code coverage plugin that will convert the coverage objects into human- and machine-readable reports at the end of the test run.
$ vue add e2e-cypress
$ npm i -D @cypress/code-coverage
+ @cypress/code-coverage@3.8.1
The @vue/cli-plugin-e2e-cypress has created folder tests/e2e where I can load the code coverage plugin from both the support and the plugins files.
// file tests/e2e/support/index.js
import '@cypress/code-coverage/support'

// file tests/e2e/plugins/index.js
module.exports = (on, config) => {
  require('@cypress/code-coverage/task')(on, config)
  // IMPORTANT to return the config object
  // with the any changed environment variables
  return config
}
Let's set the environment variable NODE_ENV=test to the NPM script command test:e2e inserted into package.json by the @vue/cli-plugin-e2e-cypress.
{
  "scripts": {
    "serve": "vue-cli-service serve",
    "build": "vue-cli-service build",
    "test:e2e": "NODE_ENV=test vue-cli-service test:e2e"
  }
}
We can place our first end-to-end spec file in tests/e2e/integration folder
/// <reference types="cypress" />
describe('Calculator', () => {
  beforeEach(() => {
    cy.visit('/')
  })
  it('computes', () => {
    cy.contains('.button', 2).click()
    cy.contains('.button', 3).click()
    cy.contains('.operator', '+').click()
    cy.contains('.button', 1).click()
    cy.contains('.button', 9).click()
    cy.contains('.operator', '=').click()
    cy.contains('.display', 42)
    cy.log('**division**')
    cy.contains('.operator', '÷').click()
    cy.contains('.button', 2).click()
    cy.contains('.operator', '=').click()
    cy.contains('.display', 21)
  })
})
Locally, I will use npm run test:e2e command to start the application and open Cypress. The above test passes quickly. Our calculator seems to add and divide numbers just fine.
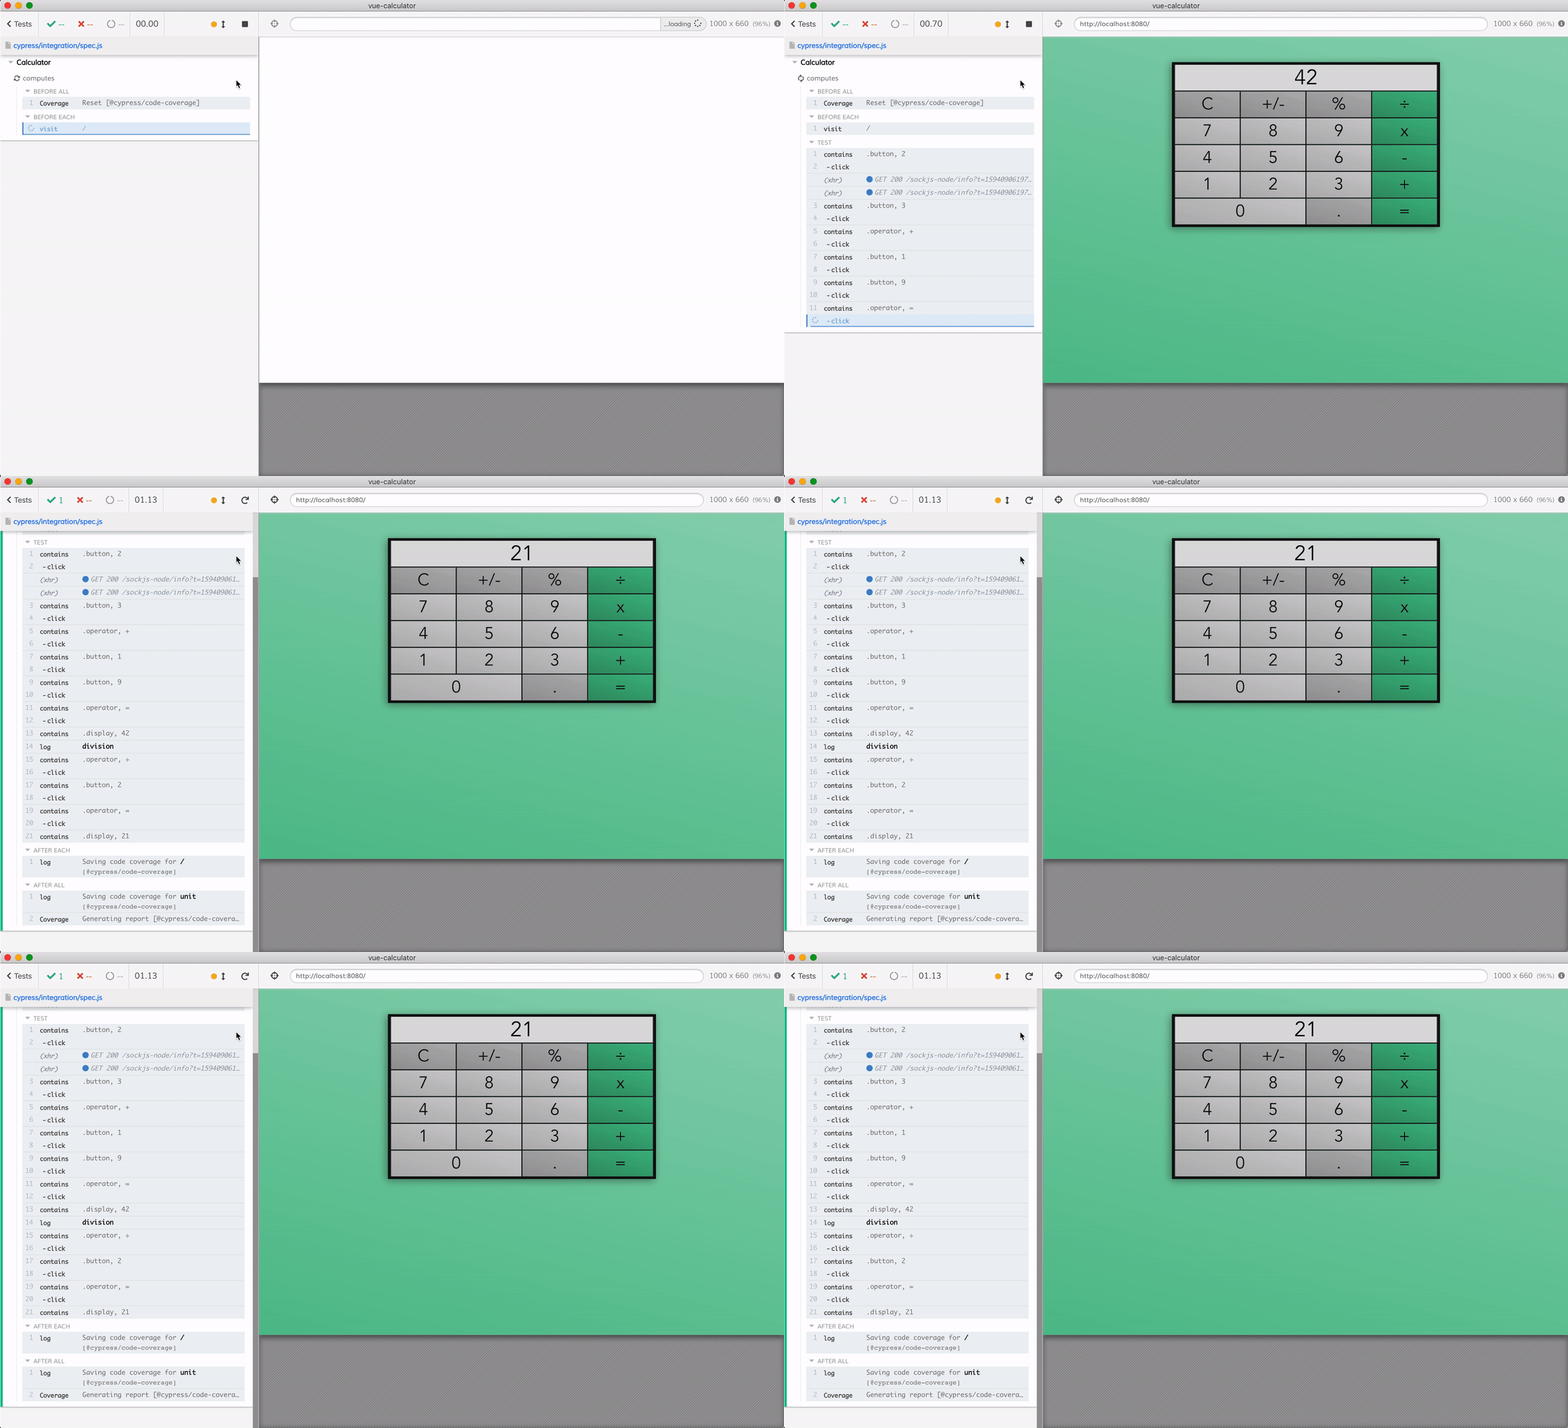
The code coverage plugin automatically generates code coverage reports at the end of the run, as you can see from the messages in the Command Log on the left of the Test Runner. The reports are stored in the folder coverage, and by default there are several output formats.
coverage/
  lcov-report/
    index.html         # human HTML report
    ...
  clover.xml           # coverage report for Clover Jenkins reporter
  coverage-final.json  # plain JSON output for reporting
  lcov.info            # line coverage report
                       # for 3rd party reporting services
While working with tests locally, I prefer opening the HTML coverage report
$ open coverage/lcov-report/index.html
The index.html is a static page that shows a table for each source folder with coverage information.

Tip: store the entire coverage/lcov-report folder as a test artifact on your Continuous Integration (CI) server. Then browse or download the report to see the collected code coverage after the test run.
End-to-end tests are effective. With a single test that loads and interacts with the entire application we have covered 60% of the source code. Even better, by drilling down to the individual files, we discover in src/components/Calculator.vue the features we have not tested yet.
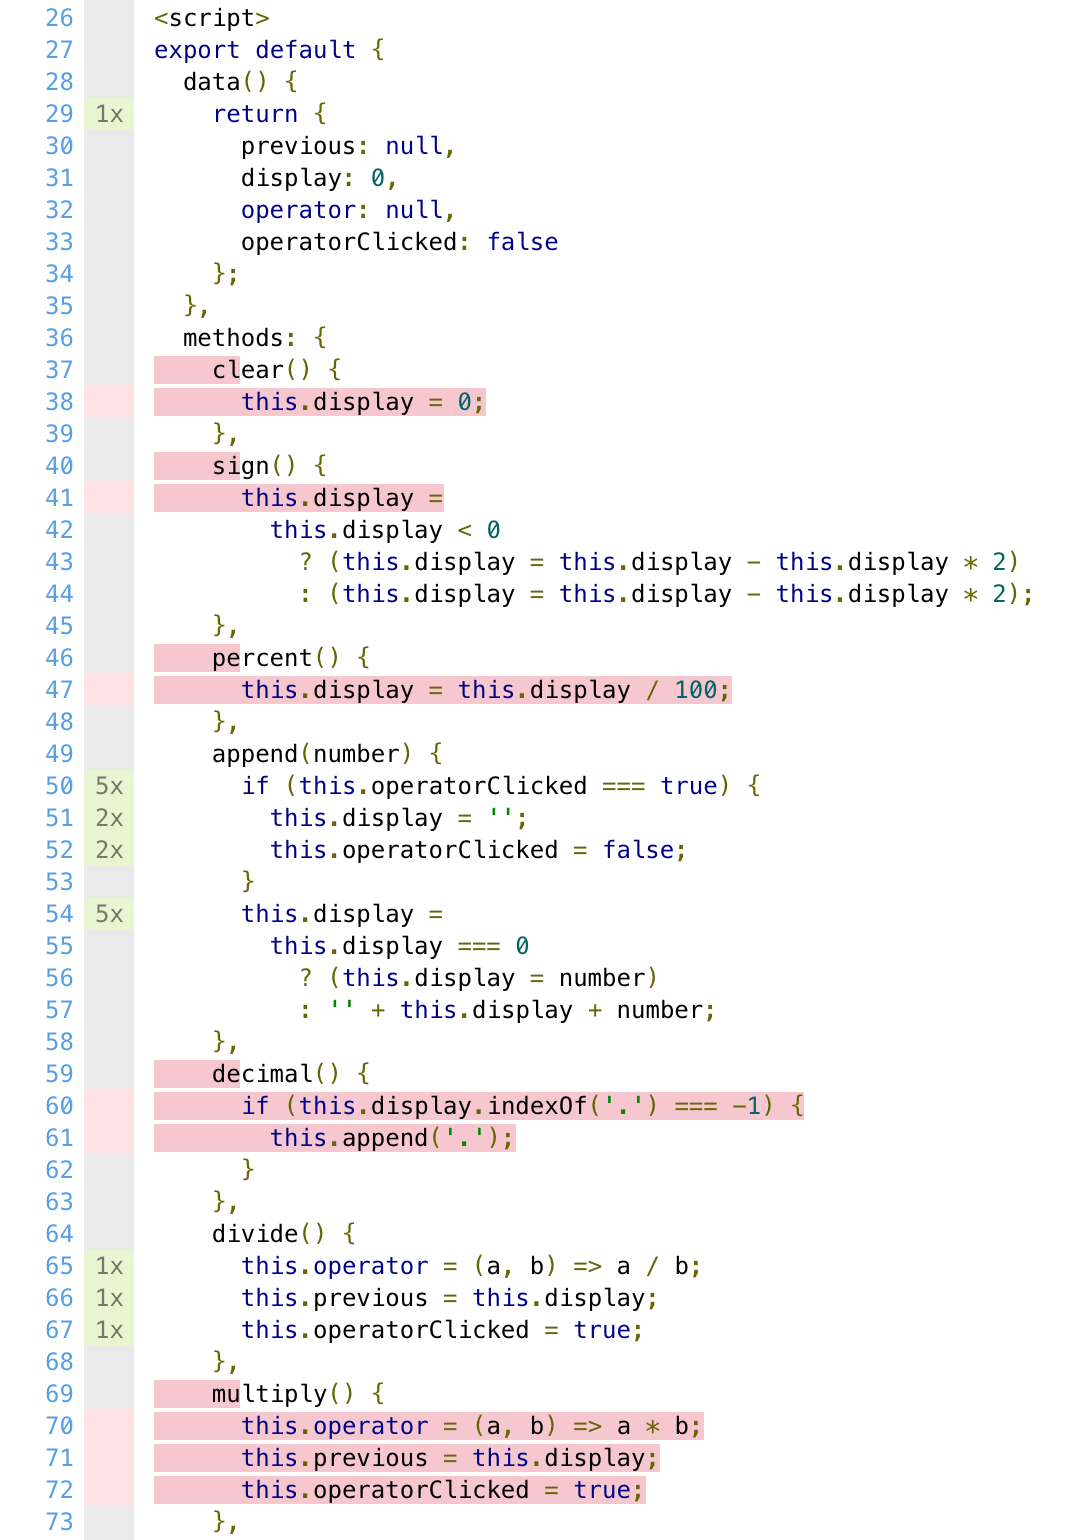
The source lines highlighted in red are the lines missed by the test. We can see that we still need to write a test that clears the current number, changes the sign, sets the decimal point, multiplies, etc. But we did test entering and dividing numbers. The test writing thus becomes following the code coverage as a guide to writing end-to-end; add tests until you hit all lines marked in red!
  Calculator
    ✓ computes adds and divides (1031ms)
    ✓ multiplies, resets and subtracts (755ms)
    ✓ changes sign (323ms)
    ✓ % operator (246ms)
As we write more tests we quickly gain coverage and confidence in our application. In the last test we will cover the decimal () { ... } method that remained red so far.
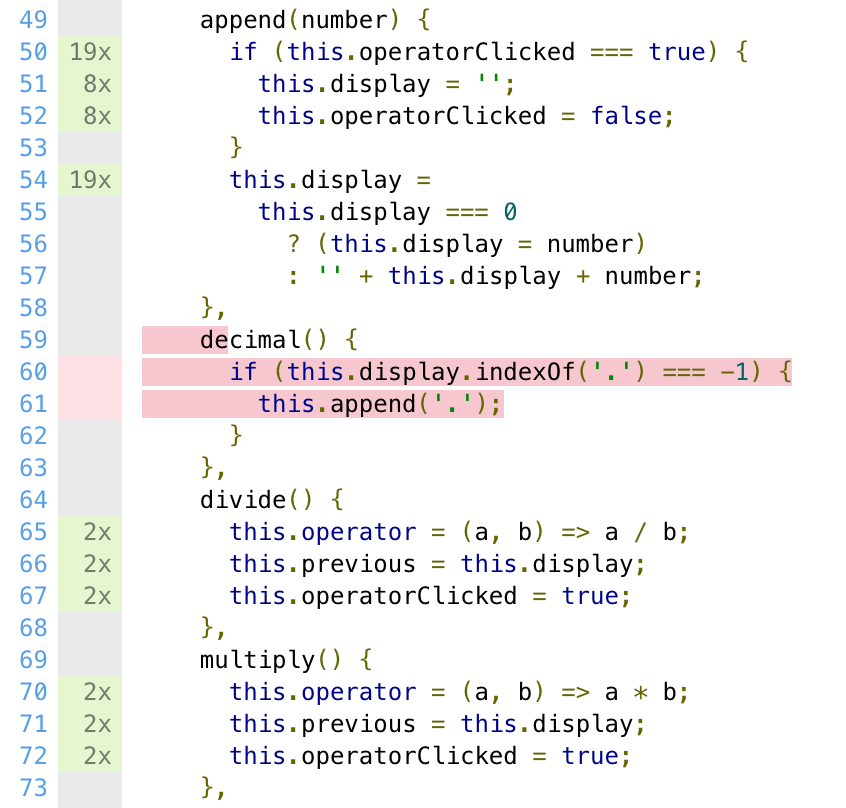
The test below types a single digit number and clicks the "." button. The display should show "5.".
it('decimal', () => {
  cy.contains('.button', '5').click()
  cy.contains('.button', '.').click()
  cy.contains('.display', '5.')
})
Hmm, this is weird, the test fails.
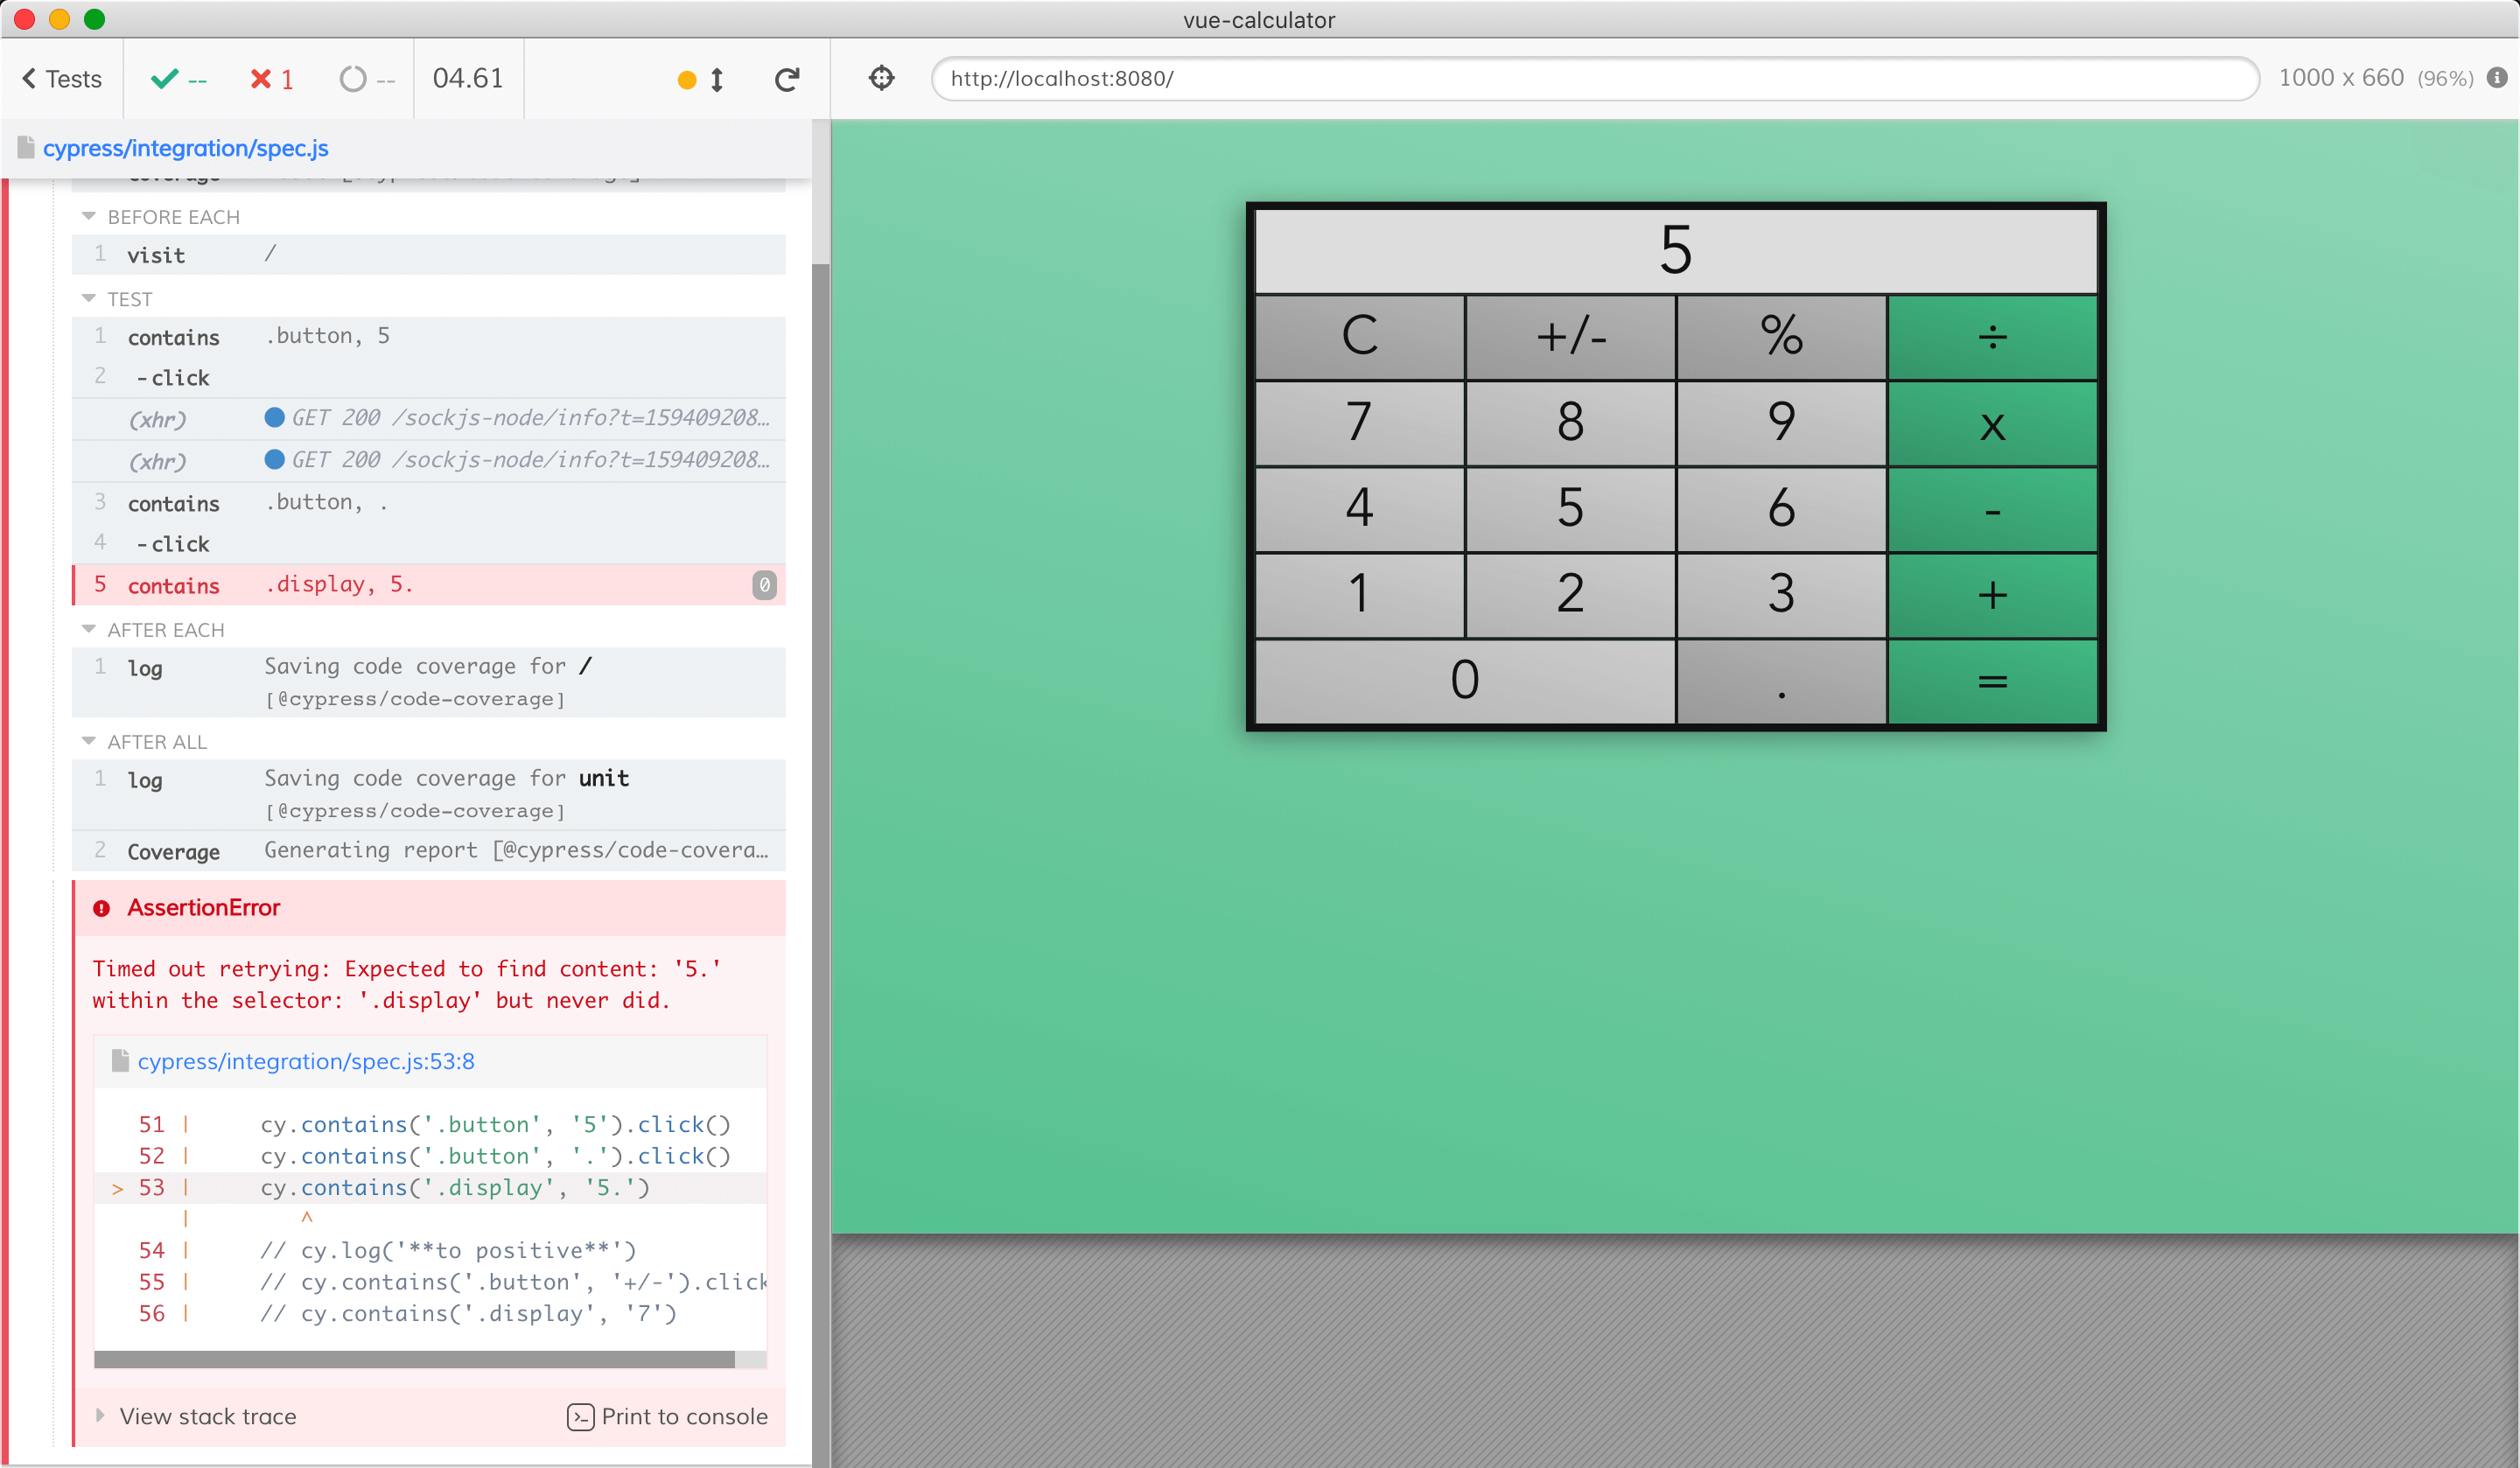
A power of Cypress test is that it runs in the real browser. Let's debug the failing test. Put a breakpoint in the src/components/Calculator.vue
decimal() {
  debugger
  if (this.display.indexOf(".") === -1) {
    this.append(".");
  }
},
Open the DevTools in the browser and run the test again. It will run until it hits the debugger keyword in the application code.

Ohh, the this.display is a Number, not a String. Thus .indexOf() does not exist and the expression this.display.indexOf(".") throws an error.
Tip: if you want Cypress tests to fail any time Vue catches an error, set the following in your code application code:
// exclude these lines from code coverage
/* istanbul ignore next */
if (window.Cypress) {
  // send any errors caught by the Vue handler
  // to the Cypress top level error handler to fail the test
  // https://github.com/cypress-io/cypress/issues/7910
  Vue.config.errorHandler = window.top.onerror
}
Let's fix the logical error in our code:
decimal() {
  if (String(this.display).indexOf(".") === -1) {
    this.append(".");
  }
},
The test passes. Now the code coverage report tells us that the "Else" path of the condition has not been taken yet.

Extend the test to click the "." operator twice during the test and it will cover all code paths and turn the entire method coverage green.
it('decimal', () => {
  cy.contains('.button', '5').click()
  cy.contains('.button', '.').click()
  cy.contains('.display', '5.')
  cy.log('**does not add it twice**')
  cy.contains('.button', '.').click()
  cy.contains('.display', '5.')
})
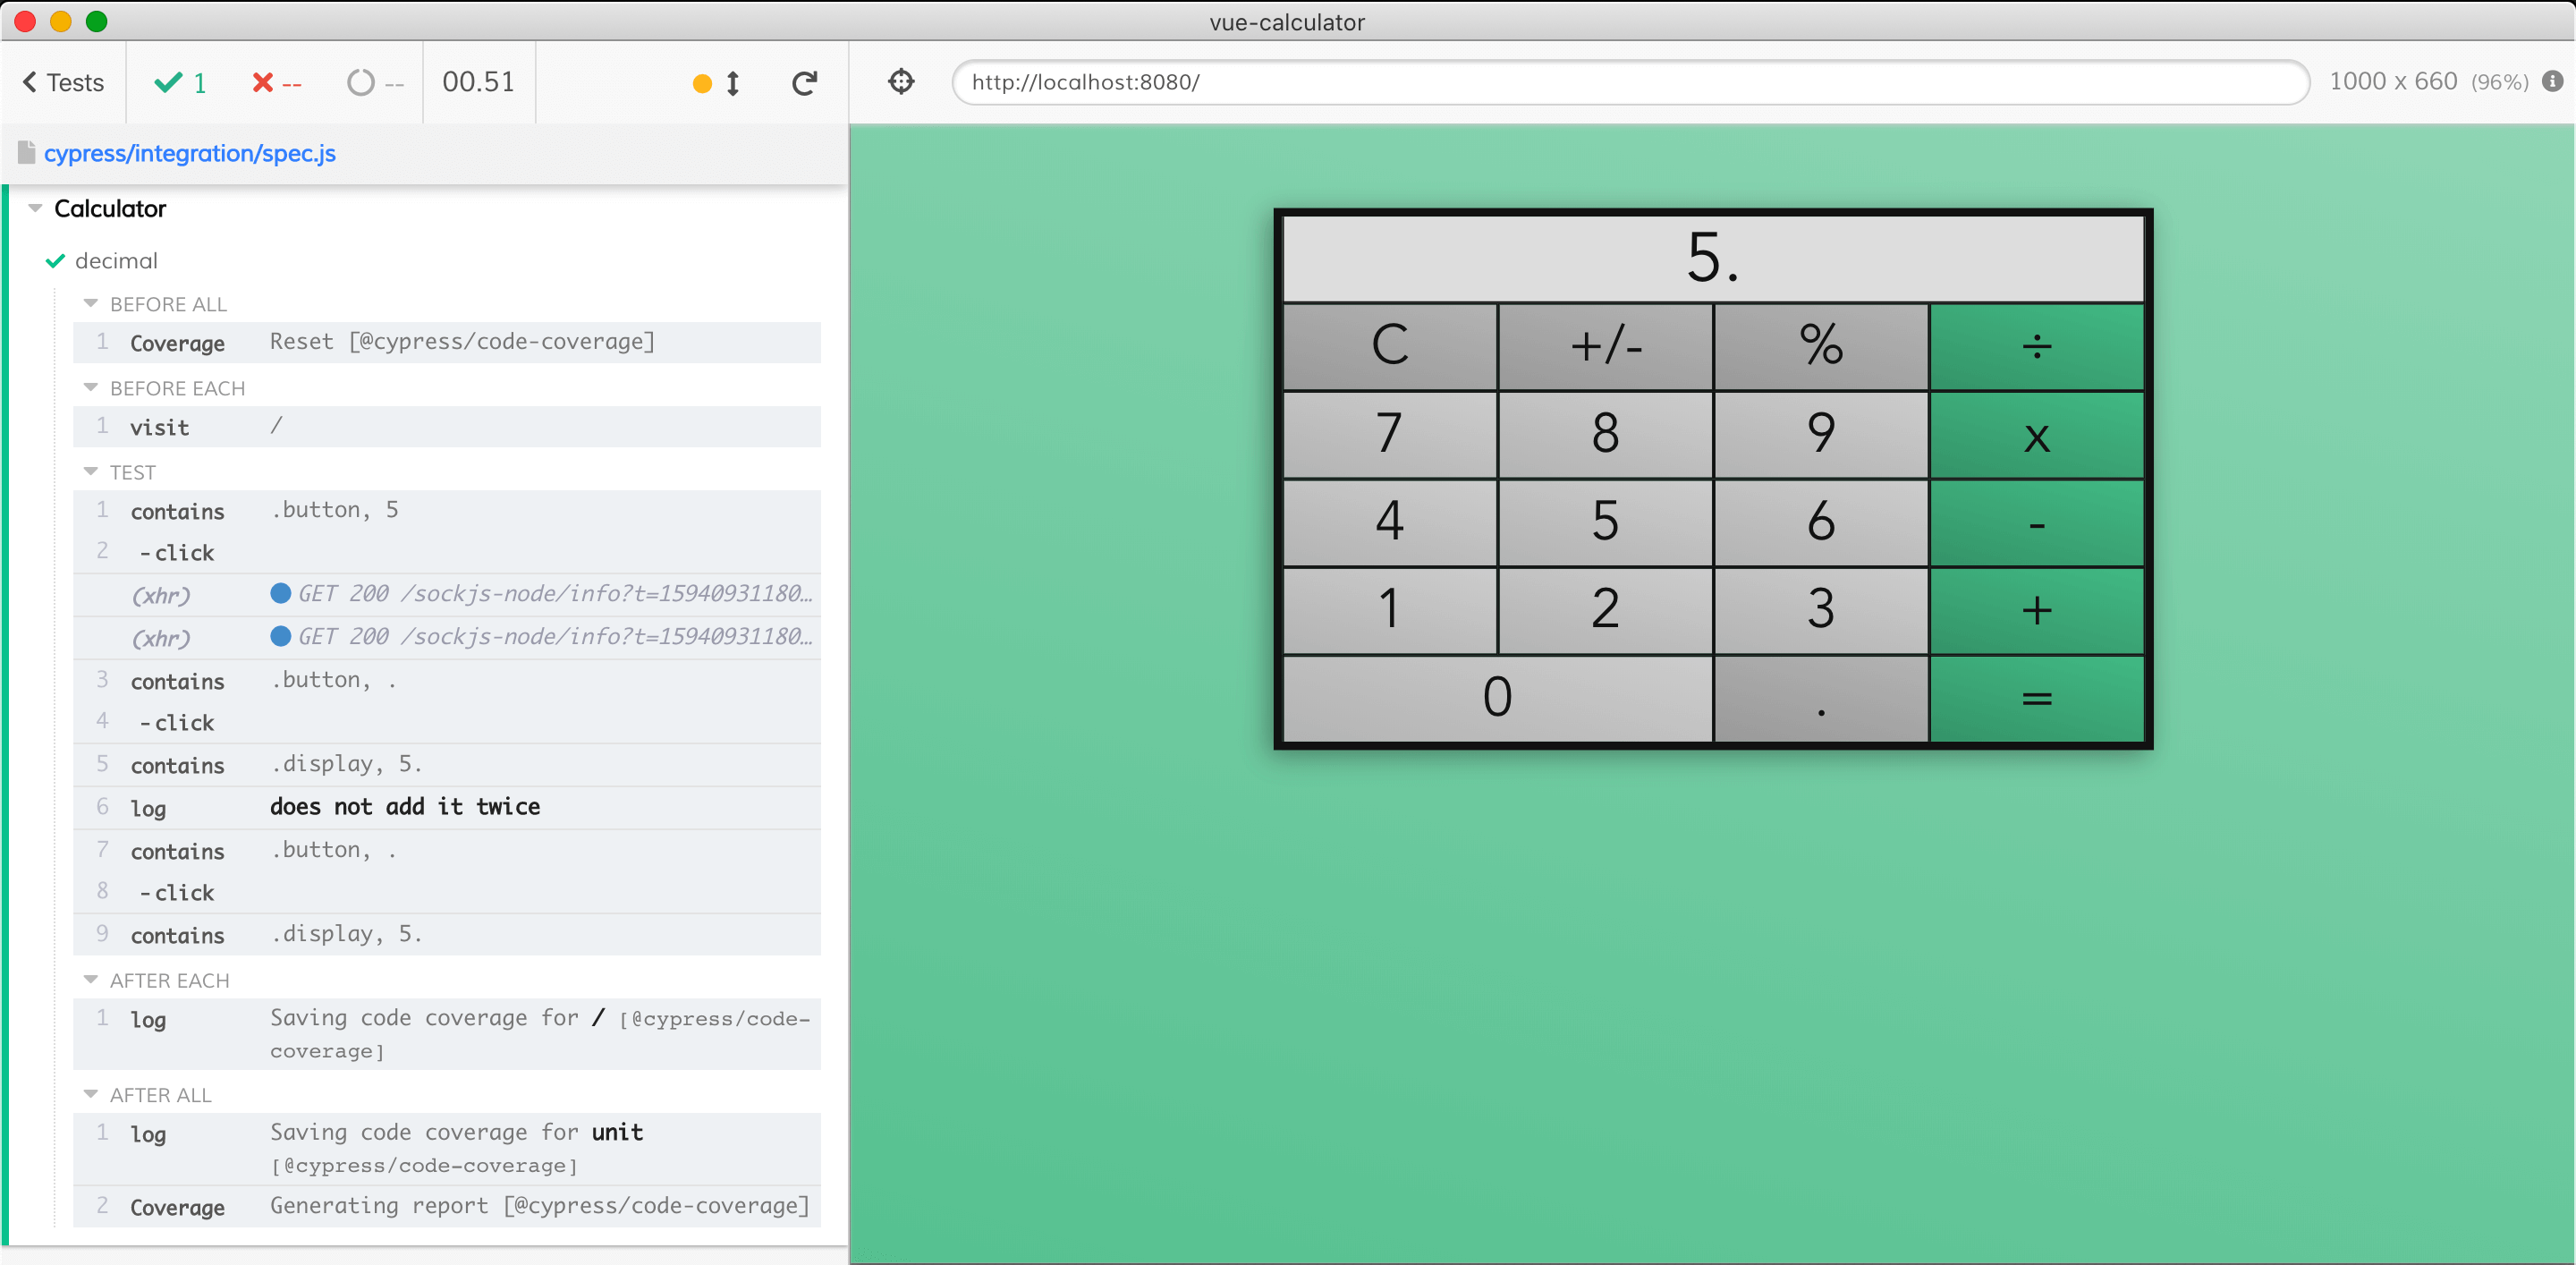

Now let's run all tests again. All tests pass in less than 3 seconds
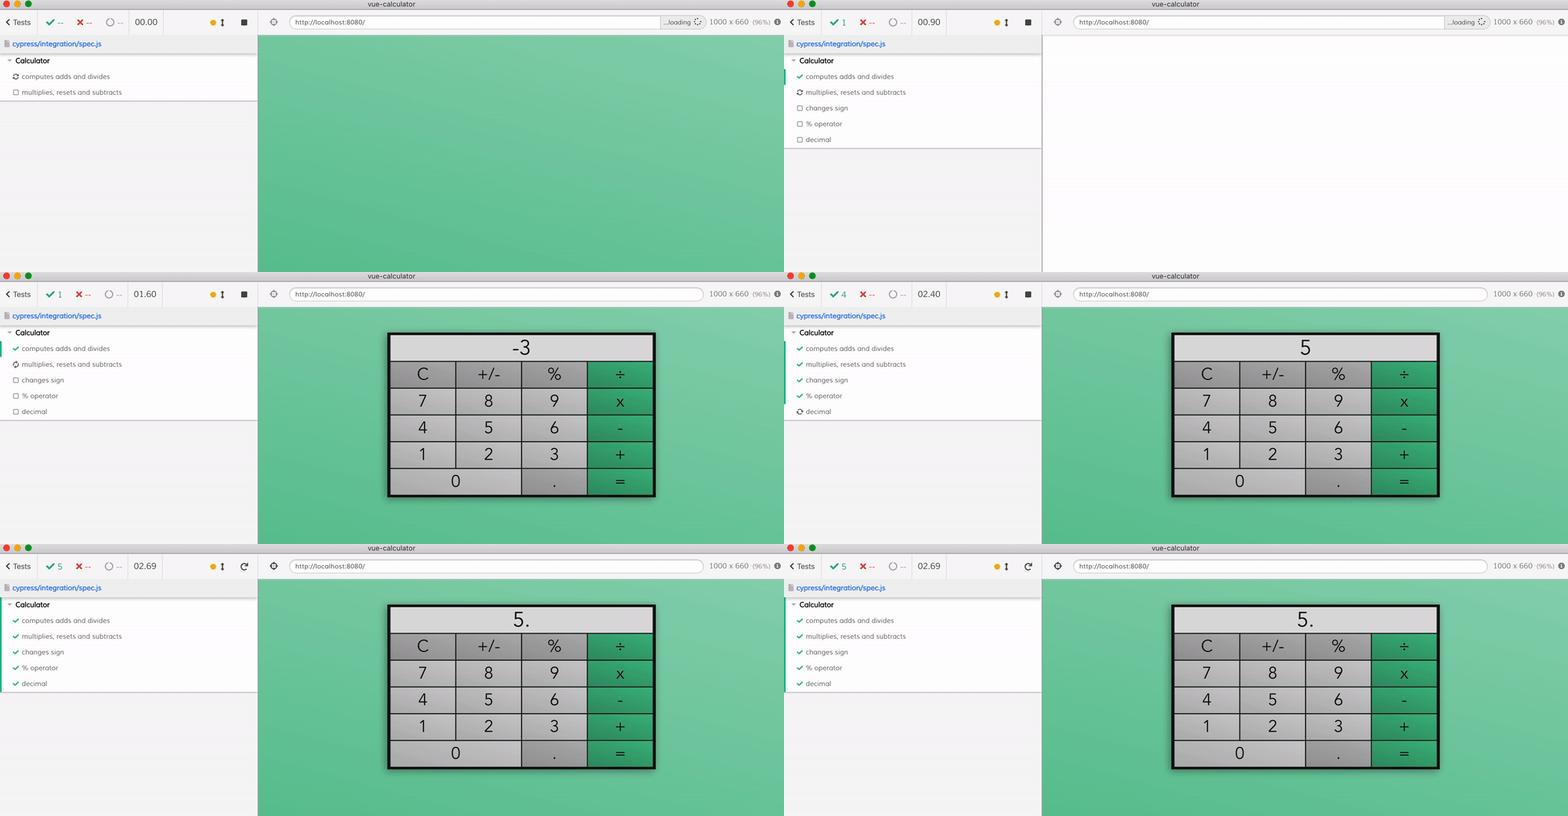
And the tests together cover our entire code base.

Conclusions
- adding code instrumentation to Vue projects is simple if the project is already using Babel to transpile the source code. By adding the
babel-plugin-istanbulto the list of plugins you get the code coverage information underwindow.__coverage__object. - you probably want to only instrument the source code while running tests to avoid slowing down the production build
- end-to-end tests are very effective at covering a lot of code because they exercise the full application.
- the code coverage reports produced by
@cypress/code-coverageplugin can guide you in writing tests to ensure all features are tested
For more information read the Cypress code coverage guide and @cypress/code-coverage documentation.

Click to load comments...